Western Australia 20 plus years behind Eastern States in traffic congestion policies.
A new campaign aims to get Western Australians to work quicker by reducing congestion through the adoption of high occupancy vehicle lanes already used in NSW, Victoria and Queensland.
Half a million people a day commute by car to work in the greater Perth area and, according to the Australian Census, 92% of these carry only the driver. Infrastructure Australia have predicted that by 2031 seven of Australia’s ten most congested road corridors will be in Perth, and this congestion will cost Western Australia $16 billion annually.
The campaign claims that if the State Government were to adopt its own recommendations for high occupancy vehicle lanes commuting times would be significantly reduced and the State could spend $Ms less than forecast on transport infrastructure.
The WA tax payer currently spends more than $1.5Bn per year [1] to support the transport infrastructure through the State budget. By 2030 this will increase to approximately $5.7Bn per year.
Bureau of Infrastructure, Transport and Regional Economics estimates of the ‘avoidable’ social costs of congestion for the 8 Australian capitals total approximately $16.5 billion for the 2015 financial year, having grown from about $12.8 billion for the 2010 financial year. These traffic delay increases have BITRE base case projections of the avoidable social costs of metropolitan congestion rising to around $30 billion by 2030.
The cause of congestion is a growing population, increasing car ownership, and an underinvested public transport system. The resulting, and increasing, congestion can be relieved very simply, and very affordably with Transit Lanes.
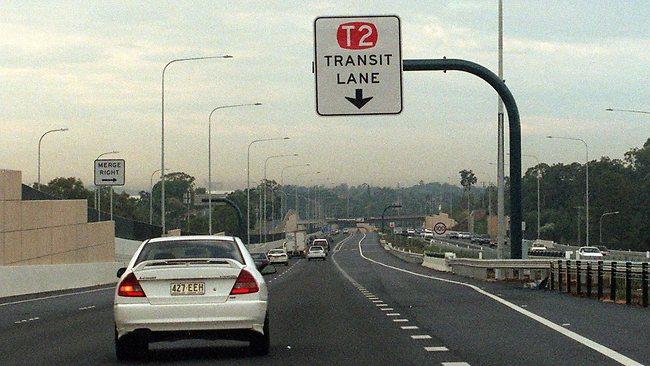
For those that have not driven around Eastern States, Transit Lanes allow cars with 2 or more people in them to share bus lanes. New South Wales, Victoria and Queensland have many Transit (T2 / T3) lanes [2] and they are used successfully around the world to relieve congestion and speed up commuting by car [3].
Spokesman for the campaign, co-founder of car-pool app Kapuddle Jamie Vine said, “Average journey times in Perth during the morning & evening peak travel times are 42% & 40% longer than normal. Car-pooling reduces congestion, reduces the increasing cost of infrastructure and reduces carbon emissions and greenhouse gases. Car-pool lanes are an affordable, proven and obvious solution, but have so far been ignored by State transport chiefs”.
The State’s comprehensive ‘Transport @ 3.5 Million’ plan published a few months ago recognised car-pooling reduced single occupancy vehicle trips, lowered the number of car trips, and the total number of kilometres travelled. However, the plan has not included any specific actions that will increase adoption of car-pooling. It has ignored its own original advice on Transit Lanes as a significant carrot to encourage car-pooling, and instead is relying on ‘Parking Strategies’ and use of levies as a stick to reduce car trips.
In the FAQ to the ‘Transport @ 3.5 Million’ plan, the Department of Transport / Main Roads stated, ‘High Occupancy Vehicle (HOV) lanes were considered as part of Transport @ 3.5 Million as an option for Perth’. Their analysis stated that although ‘on the available evidence HOV priority schemes are in general unlikely to be economically worthwhile on freeways in the Perth area, although there may be some specific ‘niche’ situations where they could be warranted.’
The campaigners are not privy to the Department of Transport’s conclusion that freeways be excluded, but were encouraged because the ‘plan’ went on to list success factors that enhance Transit Lane scheme efficiency and could result in ‘time savings of at least five to seven minutes on journeys of between 40 and 60 minutes’ [4].
In ‘The Perth and Peel Transport Plan for 3.5 million people and beyond’, the report stated, ‘Over the life of this plan, 800,000 new homes will be required to accommodate Perth’s growing population. This will nearly double the number of trips made every day in and around Perth – leading to over 12 million trips per day.’
The campaigners claim that Transit Lanes decrease the amount of cars utilising the non-Transit lane. Even during peak traffic times, Transit lanes move significantly quicker than adjacent lanes, allowing commuters to zip past traffic. With 3 people to a car, it eliminates 2 cars from the highway, reducing congestion on standard lanes while streamlining travel in the high occupancy vehicle Transit Lanes.
“On average, Transit lanes move approximately 8 km/h faster than general lanes. Depending on your commute, this could save about 10 to 15 minutes each way.” Added Jamie. “We have created an online petition to demonstrate to the State Government the demand of Western Australian’s to bring consideration for Transit Lanes (http://chn.ge/2yi8kDR).
In a story in the Sydney Morning Herald back in 2009 [5] transport experts from Monash University and RACV supported the idea.
Monash University’s Professor of Public Transport, Graham Currie, said overseas experience showed the lanes were a cheap, effective way to ease traffic on arterial roads. “The only costs for the lanes are paint and enforcement,” he said.
“It is a very obvious thing to do and one that must be done if we’re serious about reducing congestion. It means we can use the lanes more efficiently and give those that are willing to share their vehicles an advantage.”
At that time RACV spokesman Brian Negus called on VicRoads, “to investigate installing transit lanes along Melbourne’s eight existing or proposed SmartBus routes.”
Time saving isn’t the only benefit of car-pooling. Because Transit lanes require two or more individuals in one car, depending on the specific rules and local laws, car-pools also allow drivers to reduce their commuting expenses.
Reference Notes
[1] http://www.ourstatebudget.wa.gov.au/
WA State Gov Figures Include:
- $1.3 billion for METRONET Stage 1 projects, including the Thornlie-Cockburn Link and Yanchep Rail Extension, and acquisition of an additional 102 rail cars
- $237 million for construction of the Armadale Road Bridge
- $50 million for a new traffic interchange at Wanneroo Road and Joondalup Drive
- $49 million for the widening of Kwinana Freeway northbound between Russell Road and Roe Highway
- $40 million to begin works on widening the Mitchell Freeway southbound between Cedric Street and Vincent Street
- A record $129 million investment over four years to build at least 95 km of new cycling paths
- A contribution towards the construction of the Perth Busport – $142.6 million.
- Recurrent funding of the CAT and Free Transit Zone services – $15.3 million per annum.
[2] http://www.tams.act.gov.au/__data/assets/pdf_file/0005/397517/Transit_Lane_Study.pdf
In Australia, the network of transit lanes has grown significantly since 1993:
- Sydney: network has expanded to 53km of HOV lanes;
- Melbourne: network has expanded to include new T2 lanes on Hoddle Street and Tullamarine Freeway;
- Brisbane: network has expanded significantly and includes no fewer than six new T3 and eleven T2 facilities;
- Gold Coast: was not featured in the 1993 review however now has a T2 facility starting at Steven Street in Southport and running to Harley Street in Labrador and a new T3 facility on Smith Street in Southport;
- Perth: no change since 1993
[3] https://www.witpress.com/Secure/elibrary/papers/UT06/UT06019FU1.pdf
With a broad selection of HOV facilities in operation worldwide, it is relatively easy to highlight projects that have yielded positive results:
- N-VI, Madrid, Spain: Public transport mode share grew from 23.5% to 34.8% after implementation; single occupancy vehicle use on N-VI dropped from 70% of autos to 48%.
- I-5 in Portland, OR, US: HOV lane carries 33% more people than the adjacent non-HOV lane.
- Barnet-Hastings Highway, Vancouver BC, Canada: HOV lane triggered an increase in Average Vehicle Occupancy (AVO) from 1.22 to 1.35 persons per vehicle in the AM peak hour, thereby increasing the person carrying capacity of the highway by 11% .
- Long Island Expressway, NY, US: After 6 months of operation, the HOV lanes produced an increase in AVO from 1.14 to 1.30 in the AM peak period, and from 1.24 to 1.42 in the PM peak.
- I-15, San Diego, CA, US: The first 6 years of HOV lane operation showed non-HOV person trips on I-15 increased by 17% while person trips in HOVs grew 109%. The AVO increased from 1.25 to 1.38
- San Francisco Bay Area, CA, US: 33% of carpool drivers changed from driving alone to carpooling in order to use HOV lanes.
https://www.blablacar.com/blog/blablalife/car-sharing-lanes
- In Leeds, the HOV lane helped increase the percentage of people who take the bus from 1% to 20% in the space of four years!
- The HOV lane in South Gloucestershire increased the percentage of cars that take two or more people from 20% to 27%. Journey times were also significantly reduced in South Gloucestershire during the morning rush hour, before they were 21 minutes and after they were just four minutes for vehicles in the HOV lane and five minutes for all other vehicles.
[4] http://www.transport.wa.gov.au/mediaFiles/projects/PROJ_P_Perth_Transport_Plan__FAQs.pdf
including:
- The HOV forming part of an area-wide, or corridor-wide, transportation plan.
- Schemes having significant support from politicians, the community and transport agencies.
- Implementation in areas of significant congestion, with volumes in excess of 1,500 vehicles per hour per lane on freeways and 1,000 vehicles per hour per lane on arterial roads and average speeds of less than 50 kilometres per hour.
- Time savings of at least five to seven minutes on journeys of between 40 and 60 minutes are likely to be achieved.
[5] http://www.smh.com.au/national/transit-lanes-a-cheap-easy-fix-for-city-gridlock-20090110-7e22.html